A place for all your stuff. When your stuff is Logs, Events and Netflow – Oh My.
I leaned about Gravwell from the podcast Security Weekly and the explanation and thoughtfulness of “storing all your stuff” really resonated with me. Gravwell offers a “Community Edition” which allows for 2GB per day to ingest of your data. This also really gave me the impression that they understood the idea of building community and how important that is to creating products that grow to what people need.
I’m a bit of a storage hoarder and the idea of sending events and alerts to a central aggregation for searching and pretty dashboard building felt right for the Home Lab I’ve been learning and building.
This won’t exactly be a “How To” article as I am still getting much of it organized and controlled. However the documentation is stellar – https://dev.gravwell.io/docs and the install was clean.
Gravwell
I cannot say this is incredibly accurate – however I pin Gravwell as a product that brings some automation for building your own ELK Stack and it’s direct competitor I suspect is Splunk. However without the horrible choice of which data to ingest vs which data you think you don’t need to ingest so you don’t cap out your negotiated limits. I really understand why Splunk has to break its pricing down that way – you have to scale your pricing to meet your business needs – It’s just a difficult choice to make when edge clients can generate so much telemetry for your organization. It makes it really difficult to choose what to ingest and gather vs what you wait to ingest later. It makes historical data searching really difficult as far as I am concerned.
Big Animal Pictures
Visually – the dashboard and graph creation without digging through Excel sheets and tables is a very compelling way to “Search and Present” information being sent from end points and devices.
For Example – following a a documented blog post of theirs (Gravwell & Monitoring Netflow – Community Edition) I setup the OPNSense Router to send Netflow details to the Gravwell VM Server. I also had to make sure the Netflow Ingestor was installed.
Giving it some time for the network to continue its support of the household and Home Lab – I came back after an hour or so and was able to modify queries from the documentation and generate a quick map of data travels.
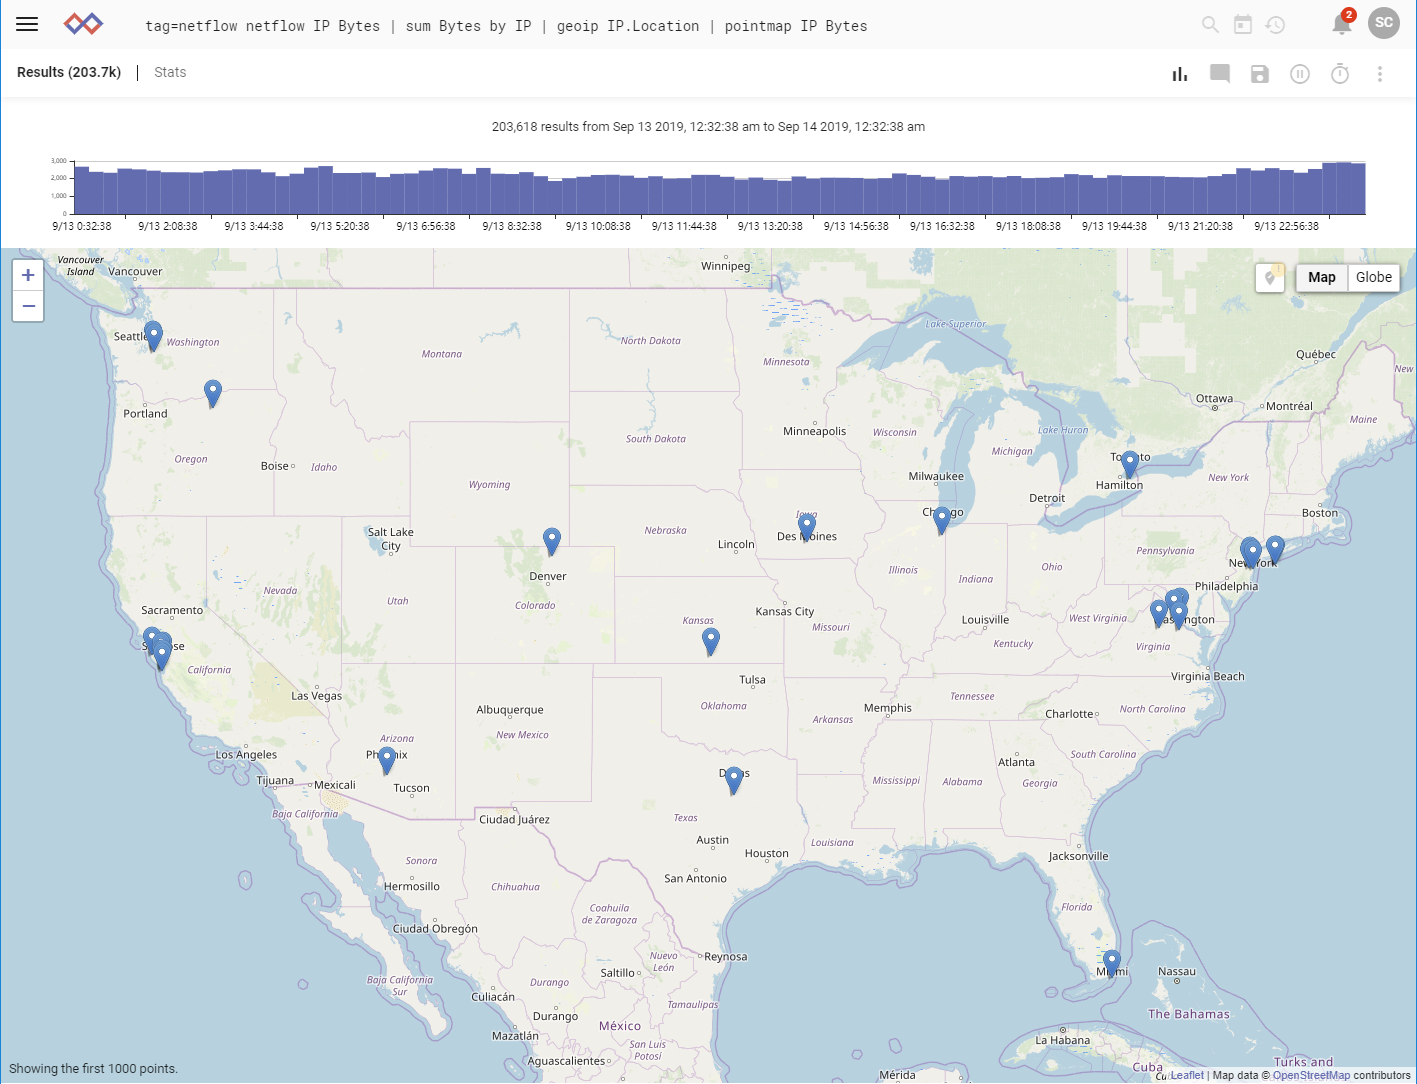
Where oh where could my IOT Data be going…
Continuing through the details of the Gravwell documentation I build out another query from the Netflow that pulling an IP address of a known IOT device – I could see where it’s been connecting to;
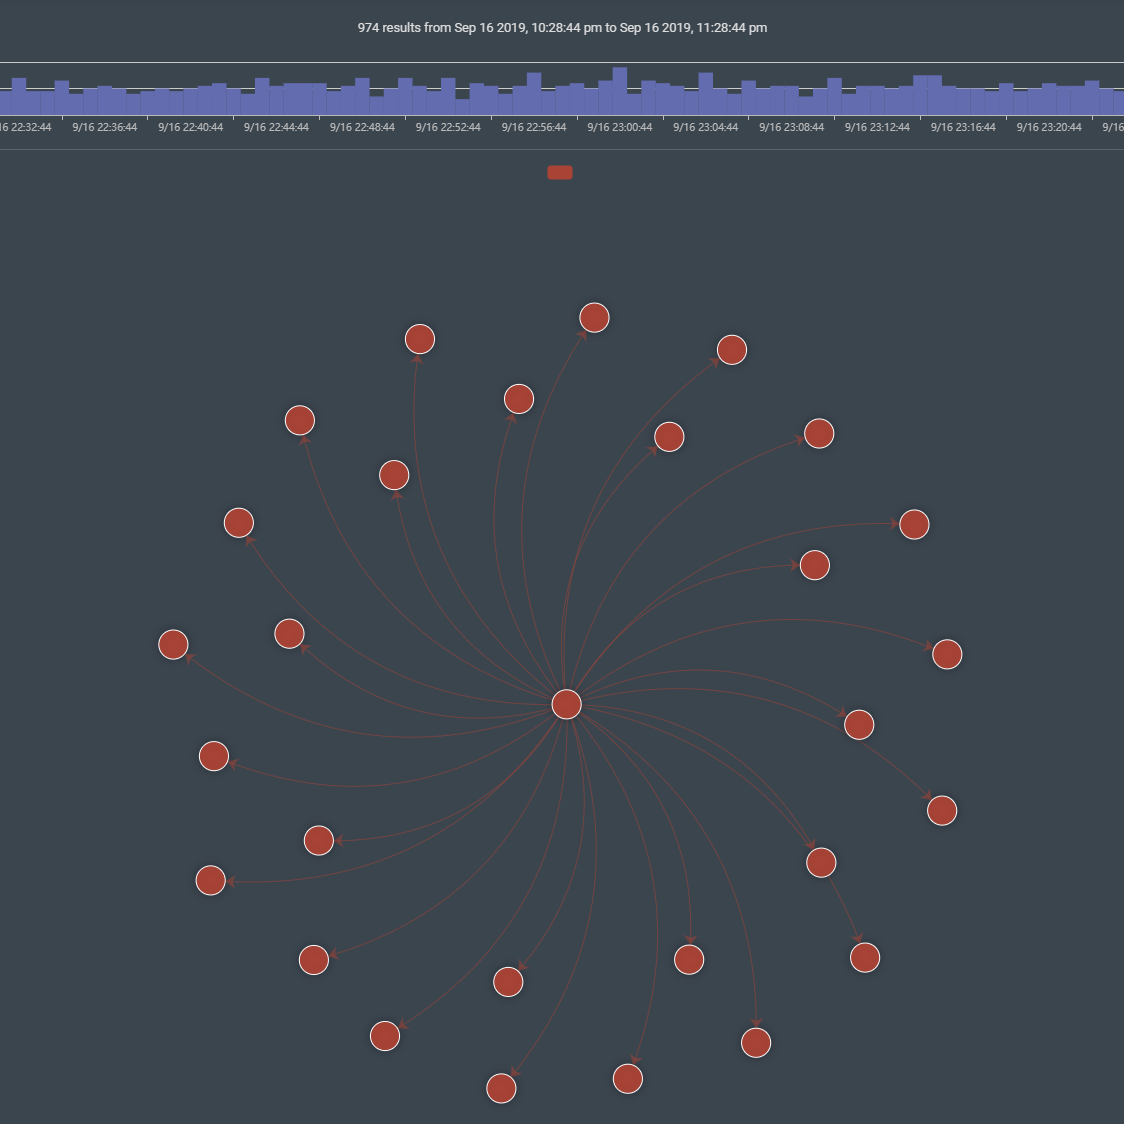
For clarity, when you hover over the ends of the Jellyfish tentacles it provides the IP address, the centered is the IOT Device I selected and the graph at the top can provide insight into the data by bytes and at what time.
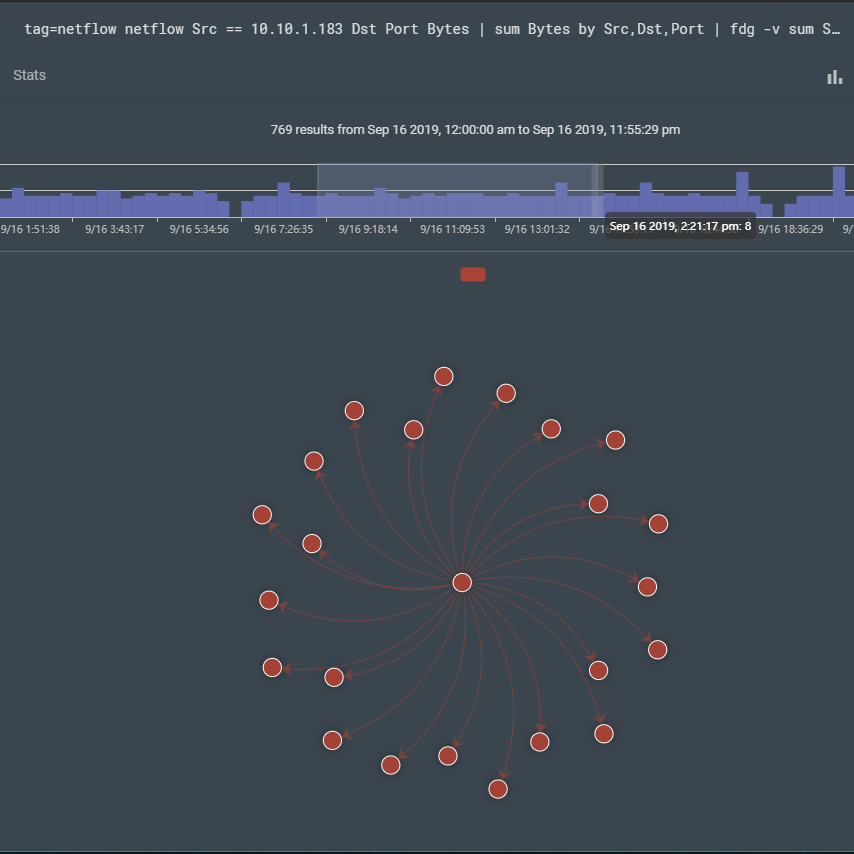
Drilling Down through Data:
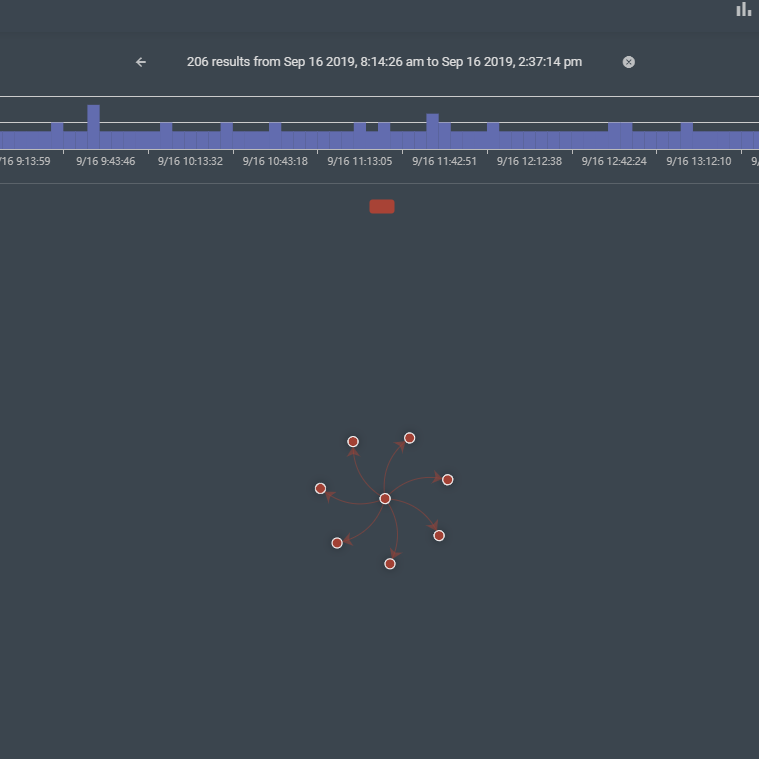
Many of the searches I do are for a few days worth of data and when reviewing if I’d like to ‘zoom’ into a section I can highlight the graph at the top and it will automatically adjust to the timeline I’ve chosen.
Original Query Selecting the time frame in the horizontal timeline:
After selecting the time frame from the timeline:
To Be Continued:
Currently most devices are reporting to Gravwell and I’ll cover in a few additional write-ups where I found the Gravwell documentation and what I did with it in the Home Lab.